

What is Government Debt?
Government debt, also referred to as national debt, is the total amount of borrowing outstanding by the government at a point in time. Debt owed by the government is often gauged relative to the size of the economy – the ratio of debt to Gross Domestic Product (GDP).
Why do Governments Borrow?
Fiji’s fiscal year (FY) runs from 1 August to 31 July. Before the start of a new FY, Government draws up a national budget outlining its projected revenues and planned expenditures for the coming FY. The projections include forecasts on the economy, funding needs of the various ministries & departments to carry out their operations and the tax policies they expect to implement. The resulting difference between the projected revenue and expenditure is called the government balance or fiscal balance. When the projected revenue is lower than the projected expenditure, government will have a budget deficit. This deficit would have to be financed by borrowing, thereby increasing government’s stock of debt.
Most developing countries, including Fiji, usually incur a budget deficit given low revenue collection and significant expenditure requirements, especially on public infrastructure that the government is expected to undertake.
No government, like individuals or businesses would borrow if they did not have to. However, governments borrow because in most cases revenue is insufficient to provide costly public goods such as infrastructure. Moreover, during times of crisis, such as the current pandemic, governments may also borrow to stimulate the economy.
What does Government Spend on?
Government expenditure mainly consists of providing public goods such as infrastructure like roads, bridges, airports and sea ports; police & defence; health; and education. Other outlays include payments for public officials, office space and the goods and services it procures. Government must also pay interest on previous loans, provide social welfare benefits to the poor, administer foreign embassies and meet financial commitments as part of its membership of regional and international bodies.
Over the last three FYs, around 30 percent of Government’s expenditure was on capital projects, which included the construction and maintenance of roads, bridges, water & sanitation facilities as well as the purchase of machinery & equipment (Chart 1). An additional 3 percent was spent on the provision of scholarships and student loans for tertiary education.
The remaining 67 percent of the total expenditure was for operating expenses. A significant portion of the operating expenses is wages & salaries of civil servants which accounts for around 28 percent of total expenditure. In the FY 2019-20, around $988 million was paid in civil servants’ wages and salaries.
Chart 1: Composition of Government Expenditure
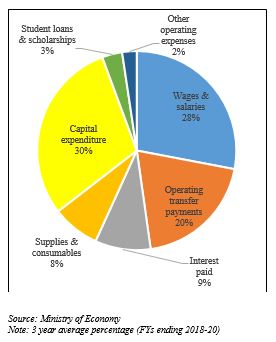
The Government also provides funding to public sector organisations such as the Land Transport Authority (LTA) and the Fiji Revenue and Customs Service to fund their operating expenditure. These transfers comprise around 20 percent of total expenditure. Additionally, around 9 percent of the government’s expenditure goes towards payment of interest on debt accumulated from past years.
What are the Sources of Government Revenue?
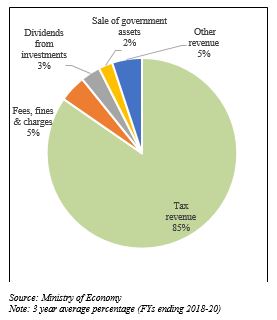
Government earns revenue from a number of sources. These include taxes on personal and corporate income and taxes on goods & services as well as other fees, fines & charges (such as the road user levy fee paid to LTA). In addition, Government also receives proceeds from privatisation or sale of its assets. Around 85 percent of the revenue is sourced from taxes (Chart 2).
There are two categories of tax revenue – direct and indirect taxes. Direct taxes are levied on income and examples include Pay as you earn, corporate tax, social responsibility tax and capital gains tax. Indirect taxes are imposed on production and consumption of goods and services such as Value added tax (VAT), Environment and climate adaptation levy (ECAL), Service turnover tax (STT), departure tax and customs and fiscal duties levied on imports.
Chart 2: Sources of Government Revenue
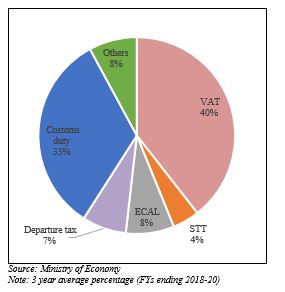
Most tax revenue comes from indirect taxes. Over the last three FYs, indirect tax collections averaged around $1.8 billion per year, representing around 72 percent of total tax revenue with VAT and customs duties being the main sources of indirect taxes (Chart 3). During the same period, direct taxes averaged $731 million per year or around 28 percent of total tax revenue.
What is the Fiscal Balance?
When government’s revenue falls short of its expenditures, the government runs a budget deficit. Government revenue averaged around $3.0 billion over the past three FYs while its expenditures averaged around $3.6 billion, implying an average deficit of around $600 million per year (Chart 4).
Chart 3: Composition of Indirect Taxes
Government’s expenditure levels increased significantly from 2016 onwards partly due to the reconstruction and rehabilitation spending needed post Tropical Cyclone (TC) Winston and then TC’s Josie and Keni. The Government spent around $500 million[1] on reconstruction and rehabilitation following these natural disasters which was spread over three FYs.
Chart 4: Revenue, Expenditure & Deficit
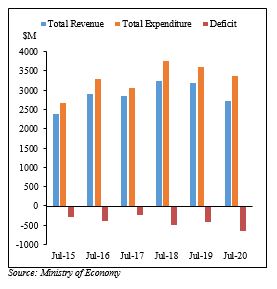
Revenue collection also increased steadily for the FYs 2015 to 2018 due to increasing economic activity, tax policy changes and improved tax compliance. However, revenue collection started to decline from 2019 onwards in line with Fiji’s economic contraction.
Where do Governments Borrow from?
Government’s fiscal deficits have been financed through a combination of domestic and external borrowings.
Governments have the option to borrow from individuals, businesses, multilateral lending institutions such as the World Bank and the Asian Development Bank (ADB) and even other governments. Typically, a government issues Treasury-bills (T-bills) or government bonds to raise these funds. The T-bills are short-term (less than one year) promissory notes issued by governments to manage temporary shortfalls or seasonality in revenue collections.
Government bonds are for periods greater than one year in which the issuer promises to pay a fixed amount of interest (or coupon) during the term of the bond and face value at maturity. When a government issues bonds, investors bid to buy it and usually the bidder who tenders the lowest interest rate is selected.
Governments have the option to issue these bonds, both domestically and externally. However, in Fiji’s case, most external borrowings are direct loans that are tied to a particular infrastructure project.
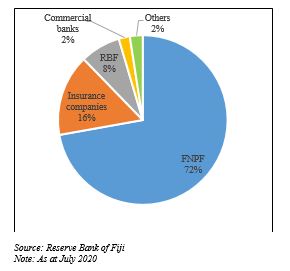
Majority of Government debt (74%) has been financed through domestic borrowing (T-bills and bonds) and was close to $5.0 billion at the end of FY 2019-20. The Fiji National Provident Fund (72%) followed by the insurance companies (16%) are the main holders of Government bonds (Chart 5) while commercial banks mostly hold T-bills.
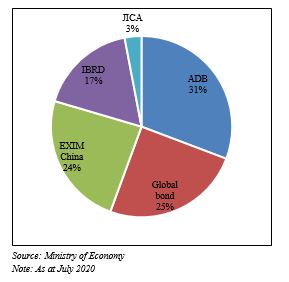
External debt made up around 26 percent of government debt or $1.7 billion at the end of the FY 2019-2020. The main creditors were the ADB, the Export-Import Bank of China (EXIM China), and International Bank for Reconstruction & Development (IBRD and part of the World Bank Group) and the Japan International Cooperation Agency (JICA) (Chart 6).
Chart 5: Domestic Bond Holders
The Fijian Government also issued an international bond for the first time in 2006 which was subsequently rolled over in 2011 and 2015 before being finally refinanced through an ADB and World Bank policy-based loan in October 2020.
Chart 6: Sources of External Debt
How has Government Debt Evolved?
Since independence, Fiji’s Government debt has continued to increase as governments have continuously run budget deficits. At the end of the FY 2018-19, Government debt was around $5.7 billion or 48.4 percent of GDP. This compares to around $3.4 billion or 56.2 percent of GDP at the end of 2010 and around $1.4 billion or 40.5 percent of GDP at the end of 2000.
Since 2010, Government debt as a percent of GDP was on a downward trajectory led by continuously positive economic growth, new revenue measures and improved tax compliance. Debt fell from 56.2 percent of GDP in 2010 to 43 percent at the end of 2015. However, the trajectory changed course from 2016 given the substantial $500 million rebuilding and rehabilitation expenditure post TC Winston, Josie and Keni.
The debt trajectory was expected to improve thereafter but was cut short by the onset of the COVID-19 pandemic and the related international travel restrictions which severely constrained Government’s revenue collections and led to a record contraction in GDP. As a result, Government debt increased to around $6.7 billion (62.8% of GDP) at the end of the FY 2019-20 (Chart 7).
Chart 7: Government Debt
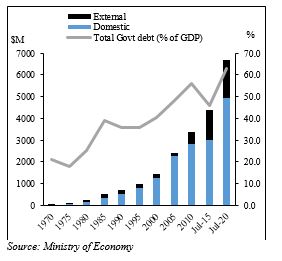
Total Government debt is forecast to rise further and reach around $8.3 billion or 83.4 percent of GDP by July 2021.
The next part of the series will cover in detail how the COVID-19 pandemic affected Government’s revenue and the future outlook of government debt. It will also cover policy options for reversing the rising debt trajectory.
[1] Source: Supplement to the 2019-20 Budget Address.